
Healthcare, and healthcare data, is more complex than ever. It can be difficult to plan for the future as government mandates, insurance, EMR, and other compliances are constantly changing. Your healthcare organization’s long-term health, and your patients’ health, may depend on how you stay on top of your data. Automated, real-time healthcare reporting dashboards are the future of data management.
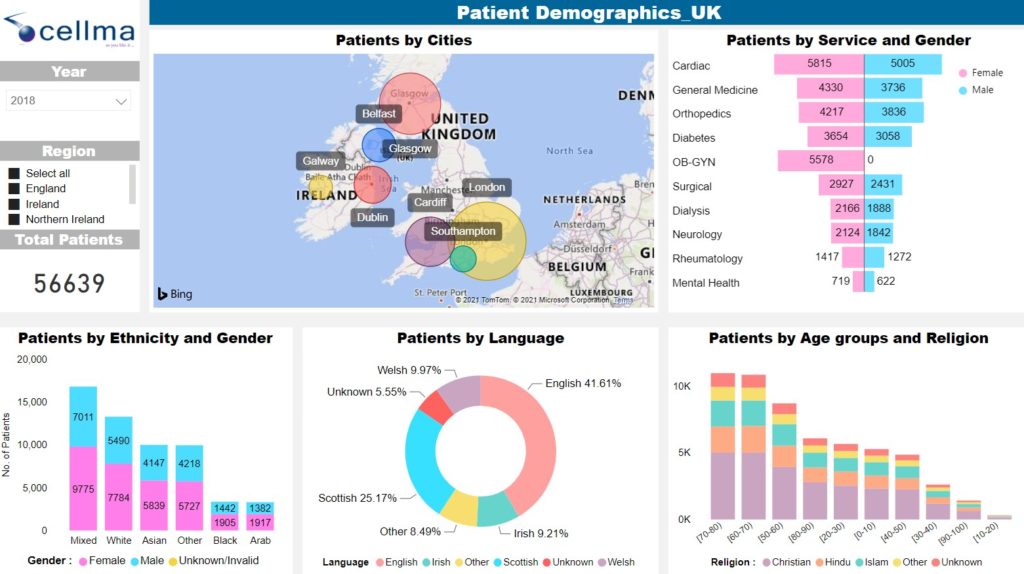
Join the numerous hospitals all around the world who are using Cellma’s Healthcare Reporting Dashboards to combine multiple data sources into secure, easy-to-digest healthcare, medical, and hospital dashboards.
With Cellma’s Reporting module, you can track healthcare KPIs like wait time, re-admissions, insurance premiums, and more. Benefits include increasing accountability, transparency, and efficiency of your healthcare organization. Visualize your healthcare data to measure improvements in patient satisfaction, outcomes, and delivery times.
Cellma provides a dynamic snapshot of user defined variables that are delivered as standard or easily customised by the user to fulfil their specific reporting requirements. The dashboards are also interactive, affording simple drill down into data.
All reports are designed to facilitate rapid understanding for the professional involved and are available in graphical and alphanumeric exportable formats.
For example: Stock management was NEVER this simple and fast!
Any stock items used during the procedures are automatically decremented from stock control dashboards. Items can be transferred to any location from central stock. Items are rapidly checked in and added to inventory using encrypted barcodes. As items are used in procedures, laboratory or imaging diagnostics, they are scanned and automatically decremented from electronic stockpiles depicted on stock control dashboards. Customisable stock dashboards provide a user-friendly way for staff to keep track of stock levels, movements and orders.
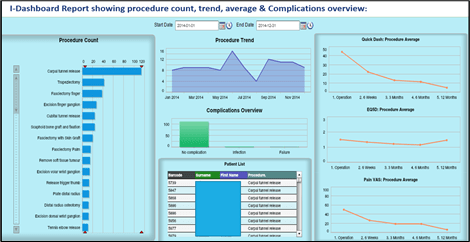
Cellma’s Ad-hoc reporting using iDashboards
Cellma produces iDashboard reports for data visualization from combined multiple data sources and found correlations necessary to make critical healthcare decisions. Please refer the below snapshot which shows an iDashboard report showing procedure count, trends, average and complications overview.
Book a Demo with us to know further about our interactive dashboards that can help your healthcare organisation to save time and cost.


